
Take Our Help to Become Data-Driven
We work with you to leverage the power of data.

About Us
We Provide Data Solutions & Digital Products
The analytical results can undeniably help businesses make data-driven decisions, enabling them to resolve business problems quickly and stay in the spotlight. From visualizing insights to tracking business operations, and become data-driven. Not allowing loopholes to deteriorate KPI performance, causing inadequate resource allocation and reducing revenue.
- Free 30-minute Consultation
- Excellent Client Service
- Innovative Solutions
Our Services
What Service We Offer

Digital Products
We offer easy-to-use Google Sheets budgeting tools designed specifically for families navigating moving expenses and everyday household finances. Simplify your planning with templates that help you stay organized, reduce stress, and stay on budget.

Data Cleaning
A process to correct and organize inaccurate, poorly formatted, and messy data. Also, the process identifies and fixes errors, duplicates, and irrelevant data from a raw dataset.
Data Mining / Data Crunching
A process of analyzing semi-structured or structured data to discover patterns and relationships in the data in order to help make better business decisions.

Data Visualization / Dashboards
Data Visualization brings data to life, allowing businesses to see a graphical representation of information and data. A dashboard is a tool used to track, analyze and display data. This usually helps a business gain insight into the overall well-being of the business or a specific process. In addition, data visualization and dashboards allow businesses to recognize patterns and issues in the data.
Allotted Grant Funds Information for various Non-Profit Organizations
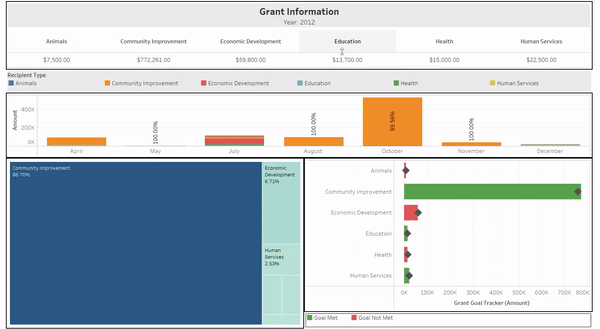
A dashboard to hone in on grant funds allotted by various types of non-profit organizations
Social Media Metric Performance Across Multiple Platforms
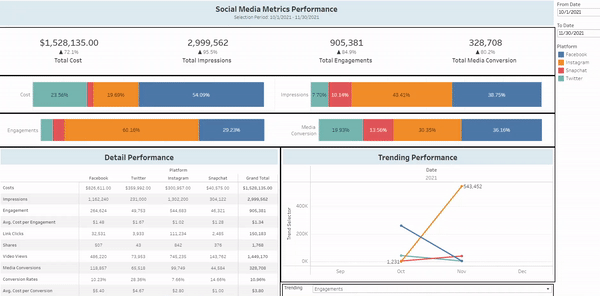
A dashboard using various social media data to provide insight on ad performance metrics
Real Estate Information
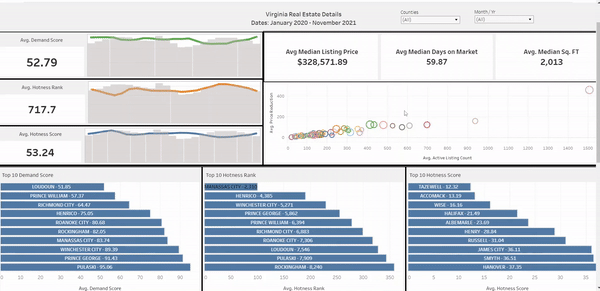
A dashboard using data from realtor.com to show hotness rank, hotness score, and demand score for VA real estate
Get in Contact

Testimonials
What Clients Say About Us
“Was very helpful and helped complete our task in a very timely manner. I would love to work with again on future projects!”
– Anita K. – Non-Profit Life Center Organization
Learn More“Has been an amazing resource for our organization. Carefully learned what our needs were for the project and implemented solutions very quickly. It was a bit of a complex project involving the manipulation of data and the creation of customized dashboards in Tableau”
– Risa R. – Non-Profit Disability Organization
Learn More“Highly recommended. Great work, met every deadline even though the time was very tight.”